Data Analysis Methodology
Exploring Relationships
In the previous section we have discussed some key ideas in statistical analysis to develop the idea that when exploring relationships between a response variable and an explanatory variable there are four possible situations to consider. The four options can be summarised diagrammatically as below:
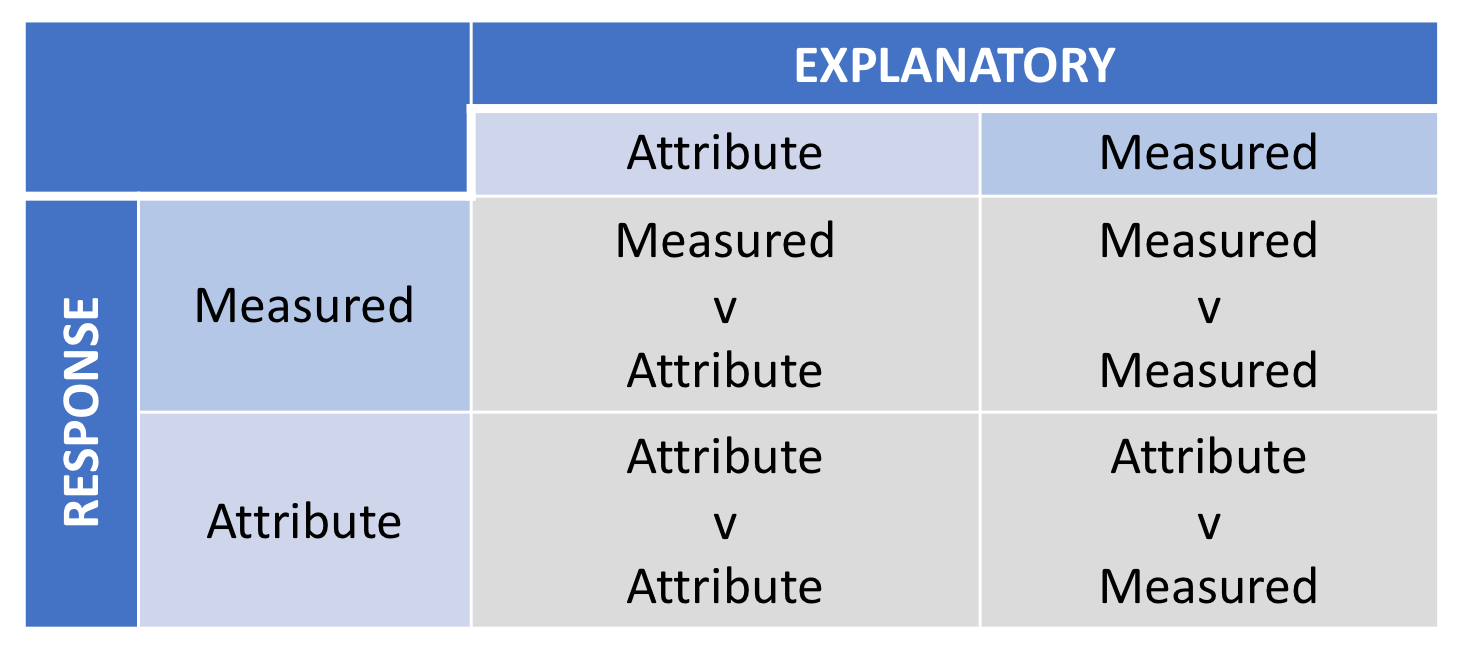
The data analysis approach to each of the four combinations is different in process, but the underlying methodology is the same.
Common Data Analysis Methodology
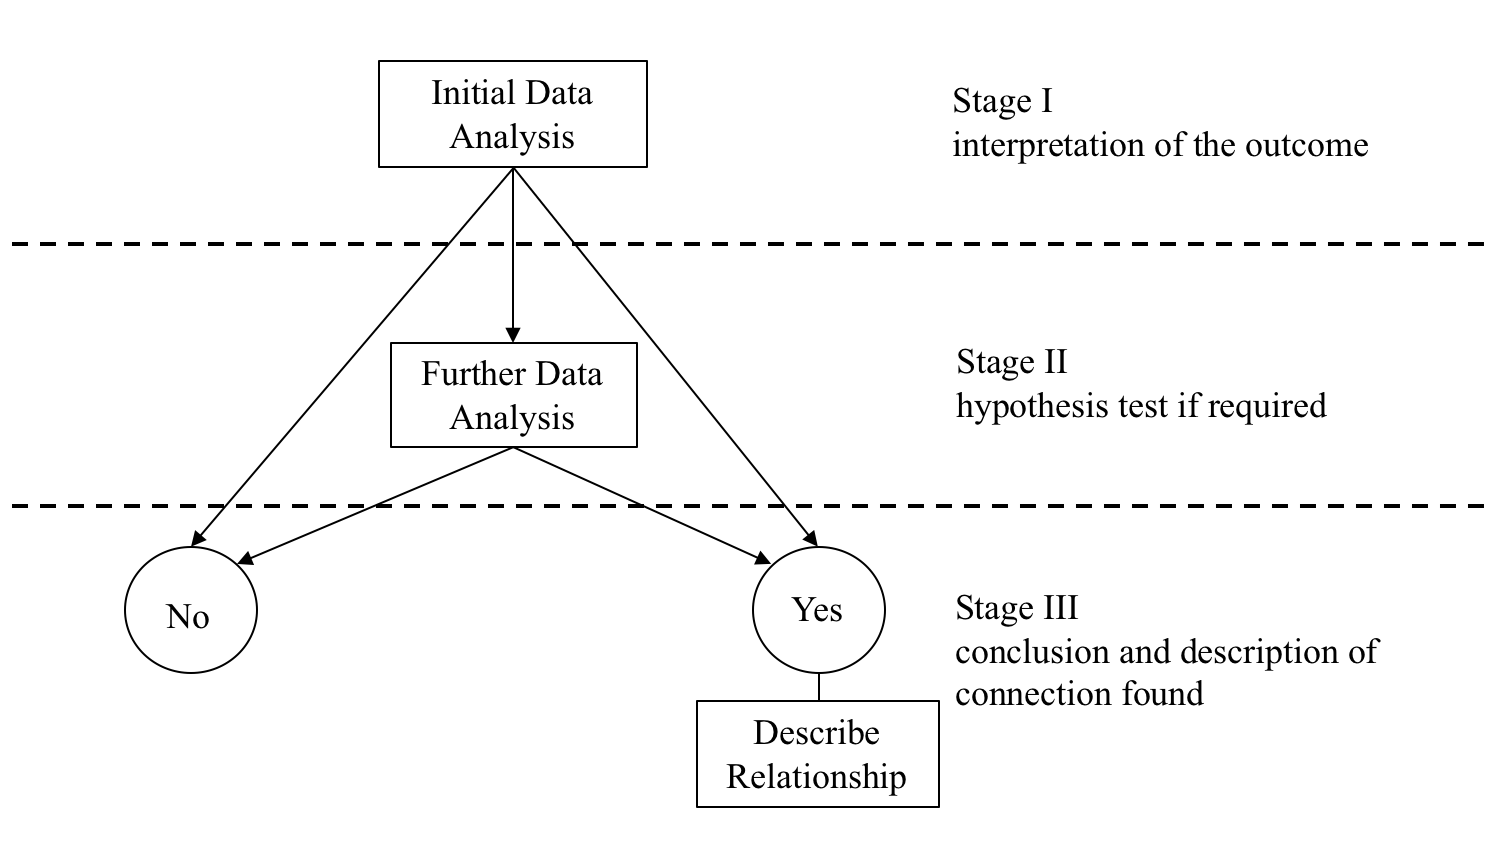
The first step is to identify the response variable and the explanatory variable under investigation, which will provide a framework for defining a Data Analysis process to explore the connection between the two variables. By using simple sample descriptive statistics we can start to investigate the nature of the link between the variables. There might be strong evidence within the sample to support a link, or it might lead us to the conclusion that there is no evidence of a link, or that the simple approach is inconclusive and further more sophisticated data analysis is required. We refer to this step as Initial Data Analysis and it is often abbreviated to I.D.A.
If the Initial Data Analysis suggests that Further Data Analysis (F.D.A.) is required, then we carry on with the analysis in order to identify the outcome of the analysis which could be one of the two alternatives:
i. The sample evidence is consistent with there being no link between the response variable and the explanatory variable -> subsequence: no further action is required by the analyst since the analysis is now complete
or
ii The sample evidence is consistent with there being a link between the response variable and the explanatory variable -> subsequence: the nature of the connection between the two variables needs to be described.
The Data-Analysis Methodology described above seeks to find the answer to the following key question: On the basis of the sample data is there evidence of a connection between the response variable and the explanatory variable?
The outcome is one of two conclusions:
No evidence of a relationship
Yes there is evidence of a relationship, in which case the link needs to be described.
As we have already seen, this process can be represented diagrammatically as:
Even if the methodology is the same for all four data analysis situations presented in the table above, the statistical concepts differ between them. Therefore, it is important to understand what statistics are required for each of the data analysis situations in order to undertake the I.D.A. and F.D.A. if needed.
© 2020 Tatjana Kecojevic